Community overview
With a population of approximately 40,000, Burlington is Vermont’s largest city. Over the last few decades, city leaders have worked to transform Church Street into a pedestrian mall and to ensure the downtown continues to be a vibrant center of retail, night life, music, art and theater. The downtown waterfront, once dominated by lumber mills and shipping terminals, is now a recreational attraction and a magnet for redevelopment. In short, Burlington has successfully made the transition from a 19th century industrial center to a diversified economy founded on manufacturing, higher education, health facilities, high tech and outdoor recreation. In 2008, the Centers for Disease Control and Prevention named Burlington as the nation’s healthiest city. Burlington frequently receives recognition as a green city, a family-friendly city, and a good place to enjoy the arts and the outdoors.
Tools you can use
In trying to determine the key design components of Vermont’s traditional neighborhoods, volunteers and staff at Smart Growth Vermont documented various dimensional and design components of existing neighborhoods in Bristol, Vergennes, Orwell and Burlington. Thus, these case studies are a bit different than other case studies in this Toolbox. They document existing features so town planners can easily visualize a traditional neighborhood layout that is often more compact than their current regulations may allow. We encourage communities to document their own historic neighborhoods, or use these case studies as a guide when updating your town’s planning regulations. Communities can visit these case study communities and gain a visual idea of how these standards play out on the ground. Many Vermont communities could not replicate the town centers in their community under current zoning bylaws. Is this true for your community?
Area Studied in Burlington

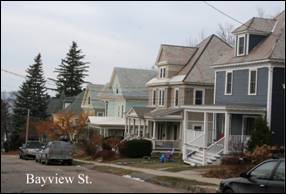
Smart Growth Vermont studied two residential blocks in Burlington, both of them located south of downtown. One of the blocks (Block 1) is in the Hill Section between South Union and South Willard Streets, close to Champlain College. Most of the houses date from the late 1800s, although a few were built in the 1940s. South Willard Street is part of the “mansion row” that was built overlooking Lake Champlain in the days when its shores were stacked with lumber and its piers busy with ships and barges. The second block is in the Five Sisters neighborhood, which was developed from the 1900s through the 1940s. This block has a similar density to the first block and the houses are more modest, though still spacious. The yards are large enough for gardens, patios, and even a few pools.
Net density in the two blocks is similar with both around 8 units per acre. Lot sizes, lot depth, setbacks and house sizes vary from street to street (View the summary table). Average lot sizes range from about .15 to .18 acres; width range from 57 to 76 feet and average lot depth range from 128 to 133 feet. The relative closeness of the houses to each other — as well as the interconnected street network that promotes walking — make for a neighborly feel that residents value.
Detail of Blocks Studied in Burlington
Block One: bounded by Bayview Ave., S. Union St., Cliff St., and S. Willard.
This block has a net density of 8.2 units per acre and a range of lot widths of 41 – 247 feet and depth of 66-260 feet. The range of living area is from 660 to 3209 sq ft. which provides options for people at different life stages and income levels. This block also contains:
- 22 single family lots
- one 2-family lots
- one 5-family lots
- one 6-family lot
Block Two: bounded by Locust St., Charlotte St., Catherine St., and Caroline St.
This block has a net density of 8.0 units per acre with lot widths that vary from 48-145 ft. and lot depths that range from 101 to 317 ft. Again, there is a range of housing options with total living area ranging from 660 to 3209 sq ft. This block contains:
- 39 single family lots
- seven 2-family lots
- one 3-family lot


